
Physics Coursework Graphing Trendlines
Main Menu
Coursework
Graphing
OTHER SECTIONS:
About Us
Bookshop
Coursework
Downloads
View/sign Guestbook
Links
Revision Tips
 Getting to Grips with Excel
Excel can add a wide range of bestfit trendlines to your graph. Here we see how easy it is to do.
Choosing a Trendline
With this particular set of data, that of radioactive decay, we really need an exponential decay curve. However we'll try out the polynomial as it generally gives a very good fit to any set of data:
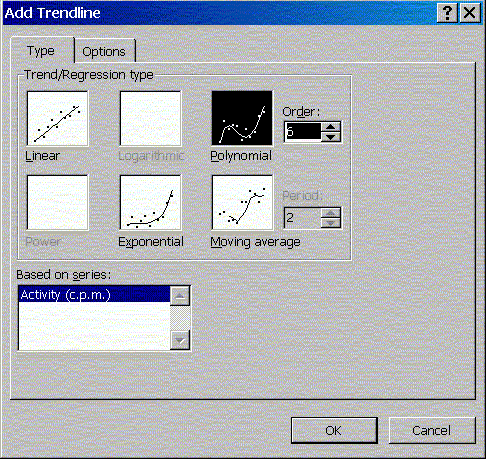
Fig. 3: Excel's Add Trendline Available Options
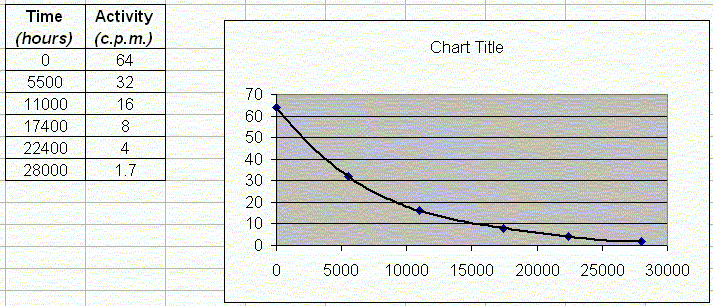
Fig. 4: Successfully added a trendline through the points
Next Page: Coming Soon!