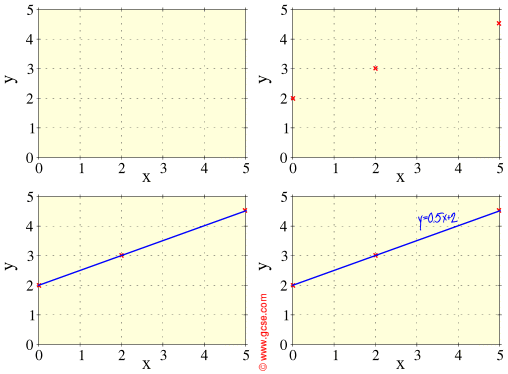
The most difficult straight x-y graphs have a gradient and a height term. Let's try our luck at plotting something: e.g. y=0.5x+2 Draw up a table as before, 3 pairs of points is enough, then get plotting:
N.B. Notice that we must use the gradient first, then the height, in calculating y-values.
Time for you to try your own!
|


