|
|
PHYSICS:
Main Menu Coursework SUBJECTS:
SECTIONS:
|
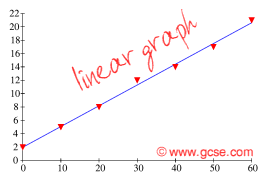
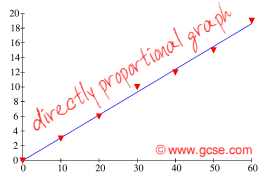
Directly ProportionalTHIS IS LEGACY MATERIAL - the science is correct but the marks no longer apply! Things are often found to behave in a so-called directly proportional relationship in physics. Here we reveal what this means. Not just a straight lineMost of the experiments you do will give you graphs that are straight lines. Only rarely are results good enough to give a directly proportional graph. Here's the subtle difference:
MathematicallyThings that are in direct proportion will produce a graph with an equation of the form: Where m is the gradient of the line. We can rearrange this to give: Since m is a constant for our graph, another way of proving proportionality is to divide one variable by the other. If this produces closely similar results, you can be certain your variables are directly proportional to each other. Things that are in a linear relationship will produce a graph with an equation of the form: Where m is the gradient, and c is the y-axis intercept. If you plot your results on a computer, it can give you the equation of the line. You can use this to say whether or not you have results that are directly proportional. Excel TemplateWe have produced a handy Microsoft Excel template to start your graph for you! Load it up and you'll see a table like this:  Enter your results in the appropriate column, removing any you don't need. The table will even average your results for you! If you've forgotten to repeat your readings, just leave column 2 blank. Click on the tab at the bottom left of the window... ... and view your graph, something like this: 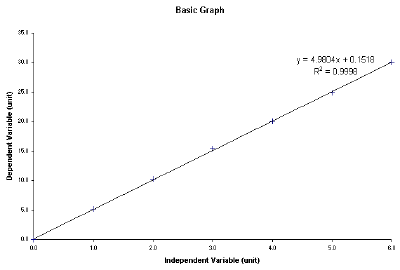 Notice that the line has this written on it: R² = 0.9998 The first is the equation for the line. The results are linear (clearly), and the very small value of the y-intercept means that we can say that our results are directly proportional to each other. The second number - the R² value - is a measure of how well the points fit to our line of bestfit (trendline). The closer R² is to 1.0000, the better the quality of the fit. In this case we can say that our results are very accurate as they fit almost perfectly to the line of bestfit. |
SPONSORS: | ||||||
| © 2004-2016 A P Harmsworth. All rights reserved. E&OE. Bookmark. Advertise. | ||||||||