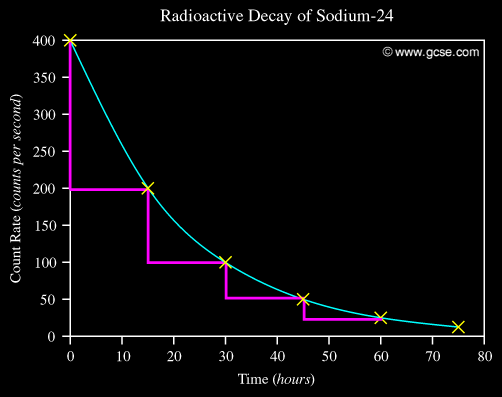
The value of a half life can be obtained from a decay curve, such as this one:
Starting at a count rate of 400, the time for this to half to 200 is indicated by the first horizontal pink line: 15 hours. This can also be checked for going from 200 to 100: 15 hours. This type of curve is called an exponential decay, as the line never quite seems to meet the x-axis.
|