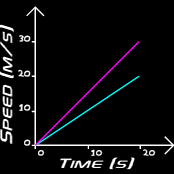
You will already have learned about acceleration. Speed-time graphs can also be used to find accelerations:
The purple line shows an acceleration from 0 to 30 m/s in 20 seconds. The blue line shows an acceleration from 0 to 20 m/s in 20 seconds.
However, things can slow down as well as speed up...
|

