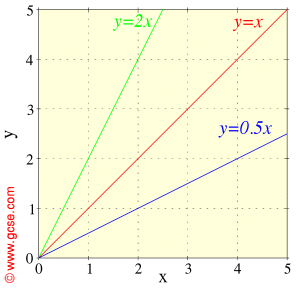
One way of drawing different x-y graphs is to make the line steeper or shallower than y=x:
The green line y=2x above is steeper than the line y=x because each value of y on the line is twice that of x. The blue line y=0.5x above is shallower than the line y=x because each value of y on the line is half that of x. The number in front of x in the formula tells us how steep the line will be. We call this the gradient.
|


