It will not have any points plotted and although the axes should be labelled they may not be scaled. The top graph shows a good sketch of the general trend shown by whatever data was looked at; it is a nice smooth curve. Unfortunately the person creating the graph forgot to label the axes! Whoops - this will no doubt reduce their mark overall. The bottom graph shows a well-labelled pair of graph axes and the points look great! However, although a pattern is implied by the crosses, there is no line! No line on a sketch graph, no way can you get full marks.
| ||||||||||||||||||||||

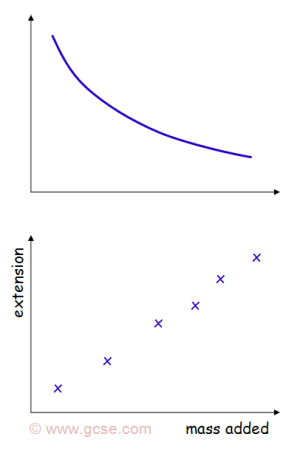 A line graph, not necessarily on a grid, that shows the general shape of the relationship between two variables.